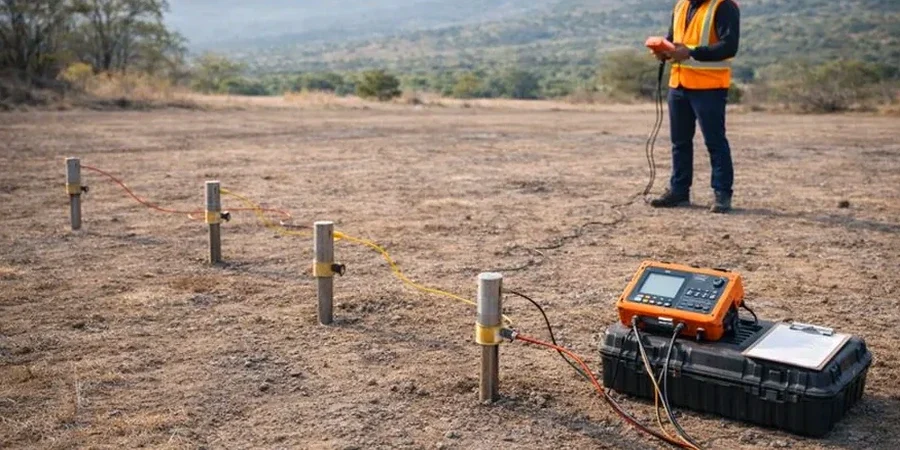
The resistivity meter goes out early in Grand Rapids. Not because it's convenient—because the glacial geology here punishes assumptions. We run a 4-electrode array across sites near the Grand River or up toward the Paris Park moraine, and the contrast between saturated sand and clay-rich till shows up immediately on the pseudosection. That's why we pair VES soundings with test pits for direct correlation: the resistivity log tells you where the transition from outwash to lacustrine clay happens, and the pit confirms it. At 42.96°N, seasonal frost depth and high water table shift apparent resistivity values enough that standard Midwest curves need local calibration. Our field crew works with Sting R1 and Syscal Pro units, laying cables on commercial lots, industrial parcels, and pre-design sites across Kent County. The data feeds directly into foundation design, groundwater exploration, and contamination plume mapping when the project demands it.
Resistivity works best where the contrast is sharp. In Grand Rapids, the boundary between saturated outwash and dense till is exactly that.
Site-specific factors
Two projects half a mile apart in Grand Rapids can behave like different geological provinces. Over in the Monroe North area, you're dealing with post-industrial fill and old river deposits: resistivity values bounce around, and without ground-truth from a test pit or auger boring, you can mistake a buried concrete slab for a natural hardpan. Out near the Walker border, where the till is thicker and drier, resistivity increases and the main risk is underestimating the depth to a competent bearing layer. The common thread is that skipping the geophysical survey leaves you blind to lateral changes. We've seen foundation designs proceed on the assumption of uniform soil—only to hit an old buried channel or a perched water table that the resistivity data would have flagged in the first pass. For brownfield redevelopment or municipal infrastructure near the river, the survey pays for itself by reducing the number of exploratory borings and avoiding re-design delays.
Frequently asked questions
What does a VES survey cost for a standard lot in Grand Rapids?
For a typical residential or small commercial lot in Kent County, VES and 2D resistivity surveys run from US$540 to US$1.080 depending on line length, electrode count, and processing requirements. Larger sites or multi-line grids are scoped by linear foot after an initial site review.
How deep can electrical resistivity imaging see in Michigan glacial soils?
Depth of investigation is roughly 20–25% of the total array spread. With a 200-foot cable layout, we can resolve features down to 40–50 feet in Grand Rapids soils. Saturated sands and clays conduct well; dry surface conditions may require pre-wetting or gel-contact electrodes.
Can resistivity distinguish between sand, clay, and till on my site?
Yes, provided there is sufficient contrast in porosity and pore-fluid conductivity. In Grand Rapids, saturated outwash sands typically read below 50 Ω·m, while dense clay-rich till reads above 80 Ω·m. We calibrate the geophysical model with at least one direct observation—test pit or boring—to anchor the interpretation.
How long does field acquisition take for a single 2D line?
A single 2D line with 56 electrodes takes 1.5 to 2.5 hours in the field, including setup, contact resistance checks, and data collection. Urban sites with hard surfaces may add time for electrode placement. We usually deliver processed sections within 3 business days.